import cv2
import numpy as np
import matplotlib.pyplot as plt
def canny(image):
gray = cv2.cvtColor(image, cv2.COLOR_RGB2GRAY)
blur = cv2.GaussianBlur(gray, (5,5), 0)
canny = cv2.Canny(blur, 50, 150)
return canny
def display_lines(image, lines):
line_image = np.zeros_like(image)
if lines is not None:
for line in lines:
#print(line)
x1, y1, x2, y2 = line.reshape(4)
cv2.line(line_image, (x1, y1), (x2, y2), (255, 0, 0), 10)
return line_image
def region_of_interest(image):
height = image.shape[0]
polygons = np.array([
[(200, height), (1100, height), (550, 250)]
])
mask = np.zeros_like(image) ## 0으로 구성되어있는 행렬 생성??
cv2.fillPoly(mask, polygons, 255)
masked_image = cv2.bitwise_and(image, mask)
return masked_image
image = cv2.imread('test_image.jpg')
lane_image = np.copy(image)
canny = canny(lane_image)
cropped_image = region_of_interest(canny)
lines = cv2.HoughLinesP(cropped_image, 2, np.pi/180, 100, np.array([]), minLineLength = 40, maxLineGap = 5)
line_image = display_lines(lane_image, lines)
combo_image = cv2.addWeighted(lane_image, 0.8, line_image, 1, 1)
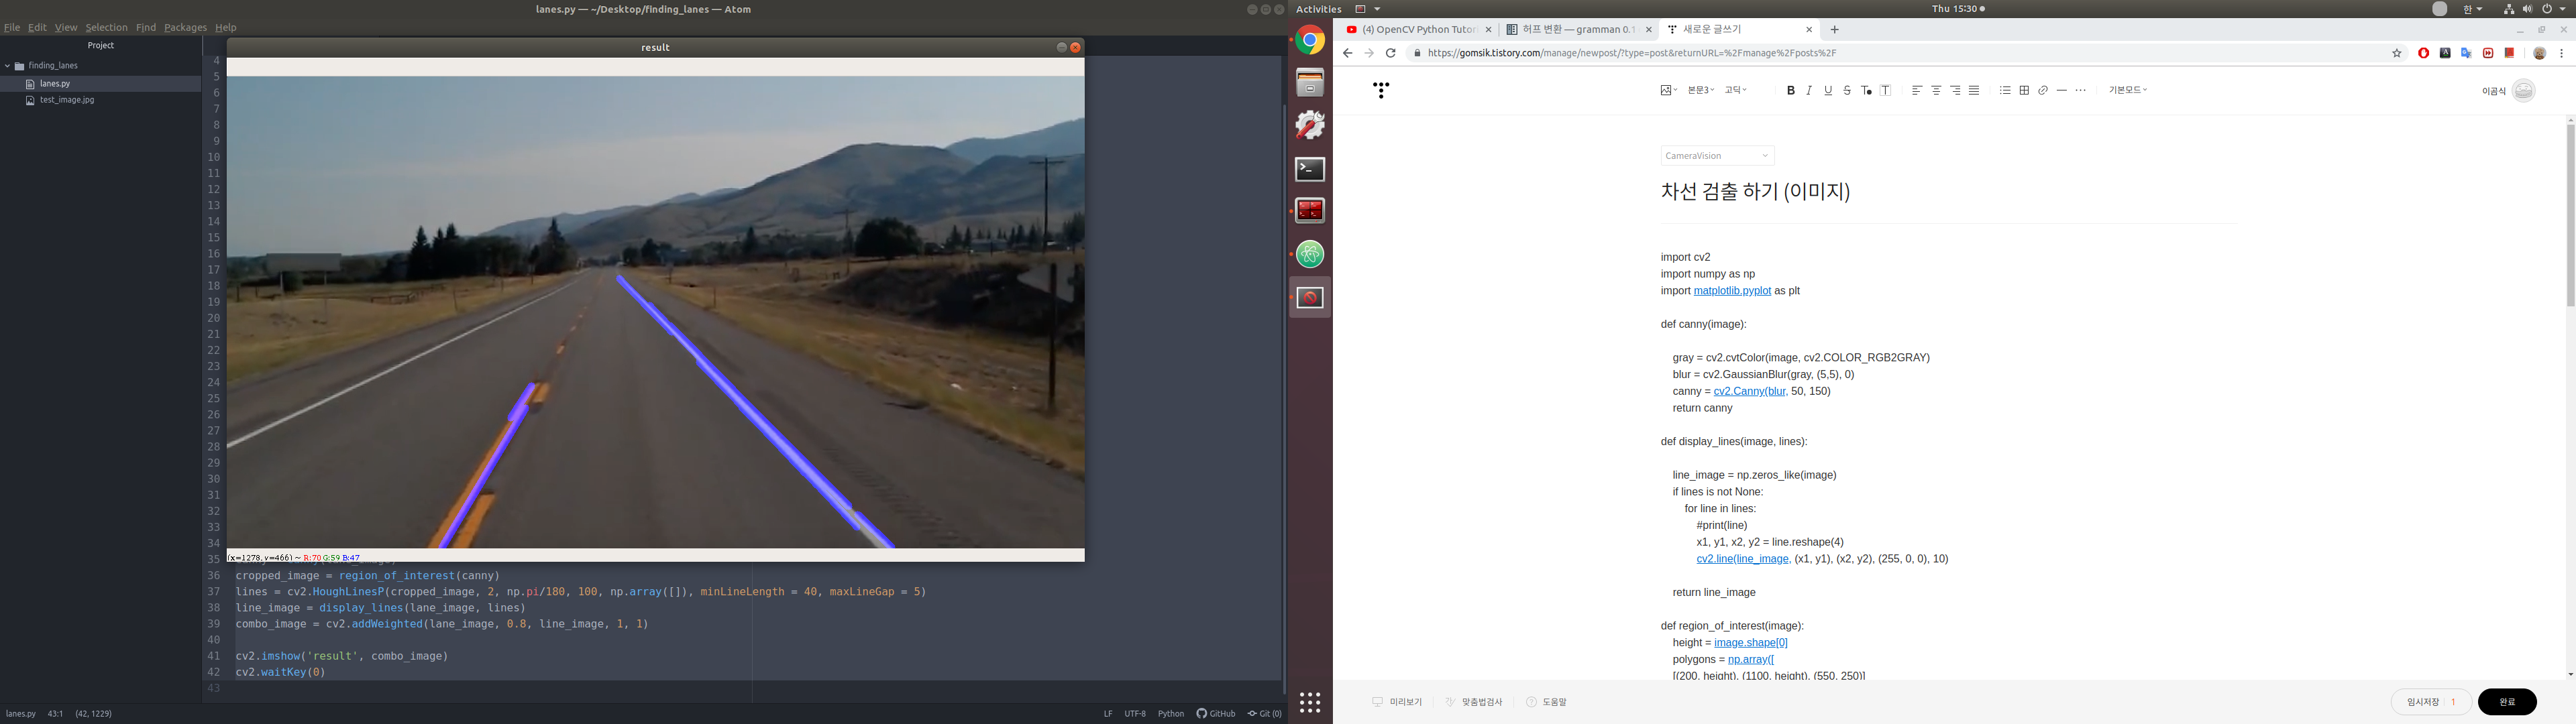
cv2.imshow('result', combo_image)
cv2.waitKey(0)
확율 허프 변환
허프변환은 모든 점에 대해서 계산을 하기 때문에 시간이 많이 소요됩니다. 확율 허프변환(Probabilistic Hough Transform)은 이전 허프변환을 최적화 한 것 입니다. 모든 점을 대상으로 하는 것이 아니라 임의의 점을 이용하여 직선을 찾는 것입니다. 단 임계값을 작게 해야만 합니다. cv2.HoughLinesP() 함수를 이용하는데, 장점은 선의 시작점과 끝점을 Return해주기 때문에 쉽게 화면에 표현할 수 있습니다.
cv2.HoughLinesP(image, rho, theta, threshold, minLineLength, maxLineGap) → lines
Parameters:
|
(영상)
import cv2
import numpy as np
import matplotlib.pyplot as plt
def make_coordinates(image, line_parameters):
slope, intercept = line_parameters
print(slope)
print(intercept)
y1 = image.shape[0]
y2 = int(y1*(3/5))
x1 = int((y1 - intercept)/slope)
x2 = int((y2 - intercept)/slope)
return np.array([x1, y1, x2, y2])
def average_slope_intercept(image, lines):
left_fit = []
right_fit = []
for line in lines:
x1, y1, x2, y2 = line.reshape(4)
parameters = np.polyfit((x1, x2), (y1, y2), 1)
#print(parameters) #print slope, y - intercept
slope = parameters[0]
intercept = parameters[1]
if slope < 0:
left_fit.append((slope, intercept))
else:
right_fit.append((slope, intercept))
left_fit_average = np.average(left_fit, axis =0) # axis = 0 means working along the column
right_fit_average = np.average(right_fit, axis=0)
left_line = make_coordinates(image, left_fit_average)
right_line = make_coordinates(image, right_fit_average)
# print(left_fit_average, 'left')
# print(right_fit_average, 'right')
return np.array([left_line, right_line])
def canny(image):
gray = cv2.cvtColor(image, cv2.COLOR_RGB2GRAY)
blur = cv2.GaussianBlur(gray, (5,5), 0) # 필터 사이즈를 크게하면 더욱 뭉게 질 수 있으니 주의하자.
canny = cv2.Canny(blur, 50, 150) # 임계값1은 임계값1 이하에 포함된 가장자리는 가장자리에서 제외합니다. 임계값2는 임계값2 이상에 포함된 가장자리는 가장자리로 간주합니다.
return canny
def display_lines(image, lines):
line_image = np.zeros_like(image)
if lines is not None:
for x1, y1, x2, y2 in lines:
cv2.line(line_image, (x1, y1), (x2, y2), (255, 0, 0), 10)
return line_image
def region_of_interest(image):
height = image.shape[0]
polygons = np.array([
[(200, height), (1100, height), (550, 250)]
])
mask = np.zeros_like(image) ## 0으로 구성되어있는 행렬 생성
cv2.fillPoly(mask, polygons, 255)
masked_image = cv2.bitwise_and(image, mask)
return masked_image
# image = cv2.imread('test_image.jpg')
# lane_image = np.copy(image)
# canny_image = canny(lane_image)
# cropped_image = region_of_interest(canny_image)
# lines = cv2.HoughLinesP(cropped_image, 2, np.pi/180, 100, np.array([]), minLineLength = 40, maxLineGap = 5)
# averaged_lines = average_slope_intercept(lane_image, lines)
# line_image = display_lines(lane_image, averaged_lines)
# combo_image = cv2.addWeighted(lane_image, 0.8, line_image, 1, 1)
cap = cv2.VideoCapture("test2.mp4")
while(cap.isOpened()):
_, frame = cap.read()
canny_image = canny(frame)
cropped_image = region_of_interest(canny_image)
lines = cv2.HoughLinesP(cropped_image, 2, np.pi/180, 100, np.array([]), minLineLength = 40, maxLineGap = 5)
averaged_lines = average_slope_intercept(frame, lines)
line_image = display_lines(frame, averaged_lines)
combo_image = cv2.addWeighted(frame, 0.8, line_image, 1, 1)
cv2.imshow('result', combo_image)
if cv2.waitKey(1) & 0xFF == ord('q'):
break
cap.release()
cv2.destroyAllWindows()
참고 :
void GaussianBlur( InputArray src, OutputArray dst, Size ksize, double sigmaX, double sigmaY = 0, int borderType = BORDER_DEFAULT );
매개변수 중에서 sigmaX, sigmaY 는 각각 X축, Y축 방향의 표준편차를 의미하며, sigmaX 의 값을 0 으로 설정하면 MASK의 사이즈에 따라 다음 식에 의해서 자동으로 계산됩니다.
출처 :
https://www.youtube.com/watch?v=eLTLtUVuuy4&list=WL&index=4&t=0s